Corretaje y trading
Bitcoin Liquidation Heatmap Explained
Fecha:
05.10.2026
Trading Bitcoin with leverage can increase profit potential, but it also raises the risk of forced liquidations. Even a small price move may close leveraged positions automatically and trigger sharp market swings. Because liquidation events often occur in clusters, many traders utilize the Bitcoin liquidation heatmap to identify where market pressure may build.
Unlike a standard price chart, a liquidation heatmap highlights exact price levels where leveraged trades are likely to be closed. It gives each trader context about volatility and possible price reactions.
Learn how Bitcoin liquidations work, read heatmap data, and see how crypto traders utilize indicators.
What Is a Bitcoin Liquidation Heatmap?
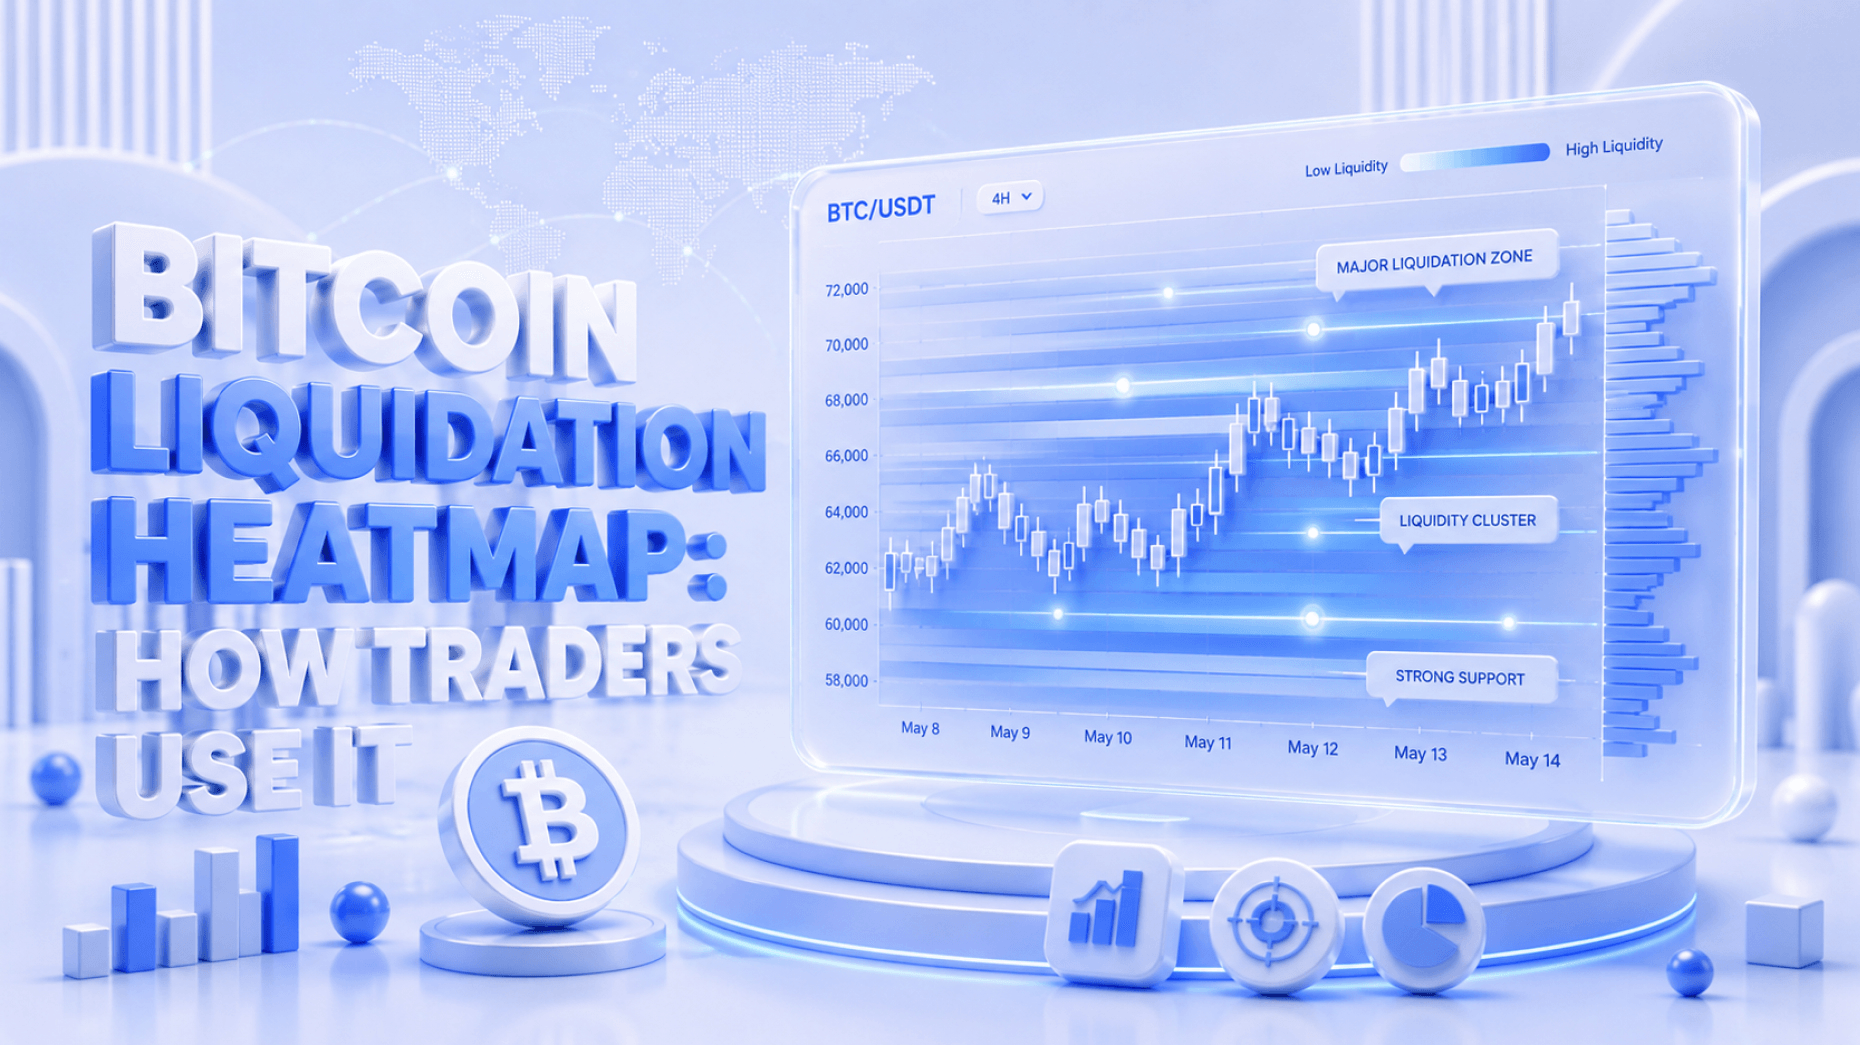
A Bitcoin liquidation heatmap is a market visualization tool that estimates where margin-based trades are concentrated and highlights the price range at which they are likely to be liquidated. Instead of displaying only historical price movements, the heatmap provides insight into potential liquidation activity based on current market positioning.
The heatmap is typically calculated using:
-
open interest (OI)
-
exchange market data
-
estimated liquidation prices
-
long and short position concentration
The result is a color-coded map where areas with a higher concentration of potential liquidations appear more prominently than regions with relatively little exposure.
Unlike traditional charts of Bitcoin price, which show what has already happened, liquidation heatmaps help active traders identify where market pressure could increase if price moves toward specific levels. These potential areas often coincide with areas of higher activity and increased volatility, making them useful for both short-term trading and broader market analysis.
For many cryptocurrency traders, the heatmap serves as a complementary analytical tool rather than a standalone indicator, helping them understand where market participants may be forced to exit their positions.
How Bitcoin Liquidations Work
To use a liquidation heatmap effectively, it's important to understand what happens when positions are liquidated. Every liquidation reflects a trader reaching the maximum acceptable loss for a position. When many liquidation orders occur at similar levels of the price, they can accelerate Bitcoin market trends and influence future trading decisions.
What Is a Liquidation?
A liquidation occurs when an exchange automatically closes a trader's position because the account no longer has enough margin to support it. This usually happens when the market moves against a leveraged trade.
The larger the position multiplier, the smaller the price movement required to trigger a liquidation event. For example, a position opened with 20x reaches its liquidation price much sooner than one opened with 2x. Both long and short margin-based trades can be liquidated. Long positions are closed during sharp price declines, while short positions are closed when the market rises rapidly.
Liquidation Clusters and Market Pressure
A liquidation cluster forms when many positions share a similar liquidation threshold. These clusters often develop around well-known support and resistance levels, recent highs and lows, or areas where smart traders tend to open positions.
When price enters a cluster, multiple liquidations may occur almost simultaneously. Forced selling from closed long positions increases selling pressure, while forced buying from closed shorts can rapidly push prices higher. This chain reaction is known as a liquidation cascade, where one wave of forced orders triggers another and amplifies market volatility beyond what normal buying and selling would produce.
The Magnet Effect
Professional traders describe large liquidation areas as a magnet for price. While the market is not guaranteed to move toward these areas, prices often gravitate toward areas where significant liquidity is concentrated.
The reason is that these areas contain a large number of potential market orders waiting to be triggered. As price approaches them, the additional order flow generated by forced liquidations can attract institutional traders and algorithmic strategies seeking to execute larger orders.
For this reason, experienced traders monitor every major zone as an area where volatility may increase, momentum may accelerate, or a temporary reversal may occur after the forced orders have been executed.
How to Read a Bitcoin Liquidation Heatmap
A Bitcoin heatmap aggregates price levels with estimated liquidation data to highlight where margin positions are concentrated. Understanding the colors, areas, and continuously updating market data helps traders interpret a BTC liquidation heatmap more effectively and identify areas that may deserve closer attention.
Heatmap Colors and Liquidation Density
Liquidation BTC heatmap typically uses color intensity to represent liquidation density. Areas with relatively few expected crypto liquidations appear in darker colors, while brighter regions indicate larger concentrations of margin-based trades.
On many platforms, yellow zones represent areas with particularly high liquidation interest. These zones suggest that a significant number of positions may be forced to close if the market reaches that price.
It's important to remember that colors do not predict future price direction. Instead, they visualize where liquidation activity could become concentrated, helping traders identify potential areas of increased volatility.
Price Levels and Liquidation Zones
A liquidation heatmap displays multiple price ranges where leveraged trades are estimated to be closed. These levels often form broader areas rather than precise prices because market positions continuously change.
Instead of focusing on a single number, traders typically evaluate the overall size and location of each zone. Large clusters located near important technical levels may attract more attention than isolated areas with relatively low exposure.
To assess the significance of liquidation areas and identify potential price reactions, compare them with:
-
support and resistance levels
-
trend lines
-
previous highs and lows
Using these analytical tools together often provides a clearer market picture than relying on the heatmap alone.
Real-Time Market Signals
One of the main advantages of liquidation heatmaps is that they continuously update using real-time market information. As traders open, close, or modify positions, the estimated liquidation information changes accordingly.
Monitoring these updates allows traders to observe how risk is distributed across the market. If new liquidation clusters appear while BTC approaches a key price level, market participants may prepare for potential volatility or faster price movements.
However, because the data changes constantly, traders should treat the heatmap as a dynamic market snapshot rather than a fixed prediction of future price action.
How Traders Use Liquidation Heatmaps
A liquidation heatmap is not designed to predict the market on its own. Instead, it helps traders identify areas where price movement could accelerate as leveraged trades are forced to close. When combined with price action and other market analytical tools, the heatmap provides valuable context for making more informed decisions. Experienced traders utilize these signals to anticipate volatility, refine entry and exit points, and manage risk more effectively when trading Bitcoin.
Finding Trade Setups
One of the most common ways traders utilize liquidation heatmaps is to identify potential trade setups around large liquidation clusters. If price approaches a zone containing a significant number of long liquidations, some traders anticipate increased selling pressure that could accelerate the downward move. Conversely, a cluster of short liquidations may contribute to a rapid upward move if those positions begin to close.
Rather than entering a trade solely because of a specific area, traders often wait for an additional trigger, such as a breakout, rejection, or confirmation from volume. The heatmap helps identify where a reaction is more likely, while technical analysis determines whether a position offers a favorable risk-to-reward ratio.
Combining Heatmaps With Open Interest
Many traders analyze liquidation heatmaps together with OI, since both tools describe different aspects of leveraged market activity. While the heatmap estimates where liquidations may occur, OI measures the total number of active derivative contracts currently open.
For example, rising OI combined with a growing liquidation cluster may indicate that more trades are accumulating around a particular price level. If price later moves into that area, the probability of stronger market moves may increase.
Using OI as a confirmation indicator helps traders distinguish between isolated liquidation zones and situations where leverage is building across the broader market.
Managing Risk With Heatmaps
Liquidation heatmaps can also improve risk management. Instead of placing stop-loss orders directly inside large liquidation clusters, traders often position them beyond these areas to reduce the chance of being caught in a temporary liquidation-driven price spike.
Also, the heatmap gives traders the opportunity to adjust their leverage based on current market conditions. When large liquidation zones are located close to the current price, many participants choose smaller position sizes or lower leverage because short-term volatility may increase.
Although a heatmap cannot predict every reversal, it helps traders recognize where sudden price movements are more likely to occur and avoid placing positions where they could be unnecessarily closed.
Limitations and Best Practices
Despite its usefulness, a Bitcoin liquidity heatmap has several important limitations. The displayed liquidation levels are estimates based on available market data rather than exact positions held by every trader. Different platforms collect information from different exchanges, so BTC heatmaps from separate providers may not look identical.
Liquidation levels also change continuously as traders open, close, or adjust positions. A zone that appears significant now may lose relevance within hours. Data quality and update speed vary by provider, and even small delays can reduce accuracy during periods of extreme volatility.
To use the tool more effectively:
-
Treat heatmap data as an estimate, not a precise prediction.
-
Compare data from reliable providers and supported exchanges.
-
Confirm signals with price action, volume, funding rates, and OI.
-
Recheck intense liquidation zones regularly because market positioning changes in real time.
-
Avoid entering trades based on one heatmap signal alone.
-
Account for news, macroeconomic events, and sudden shifts in sentiment.
The crypto market remains highly dynamic, so a heatmap should be used as one component of a broader trading strategy rather than as a standalone decision-making tool.
BTC Liquidation Heatmap: Key Takeaways
A liquidation heatmap BTC provides valuable insight into where positions are concentrated and where market volatility may increase if price reaches key liquidation zones. By visualizing potential areas of market pressure, it helps traders better understand how leverage influences short-term price movements and identify locations that may deserve closer attention.
However, the heatmap is most effective when used alongside other analytical tools rather than in isolation. Combining liquidation data with price action, OI, volume, and technical analysis creates a more complete picture of market conditions.
Used correctly, the Bitcoin liquidation heatmap becomes a practical addition to a trader's toolkit, helping traders improve market awareness, refine risk management, and support more informed decisions in the fast-moving crypto market.
¡digitalice su
¡digitalice
su
negocio
hoy!
Libere su potencial con nuestra potente solución core: la base sobre la que su negocio crecerá durante años.


